© Benaki Phytopathological Institute
Demirözer
et al.
68
mortality obtained in three spore concen-
trations did not differ significantly between
them (P>0.05).
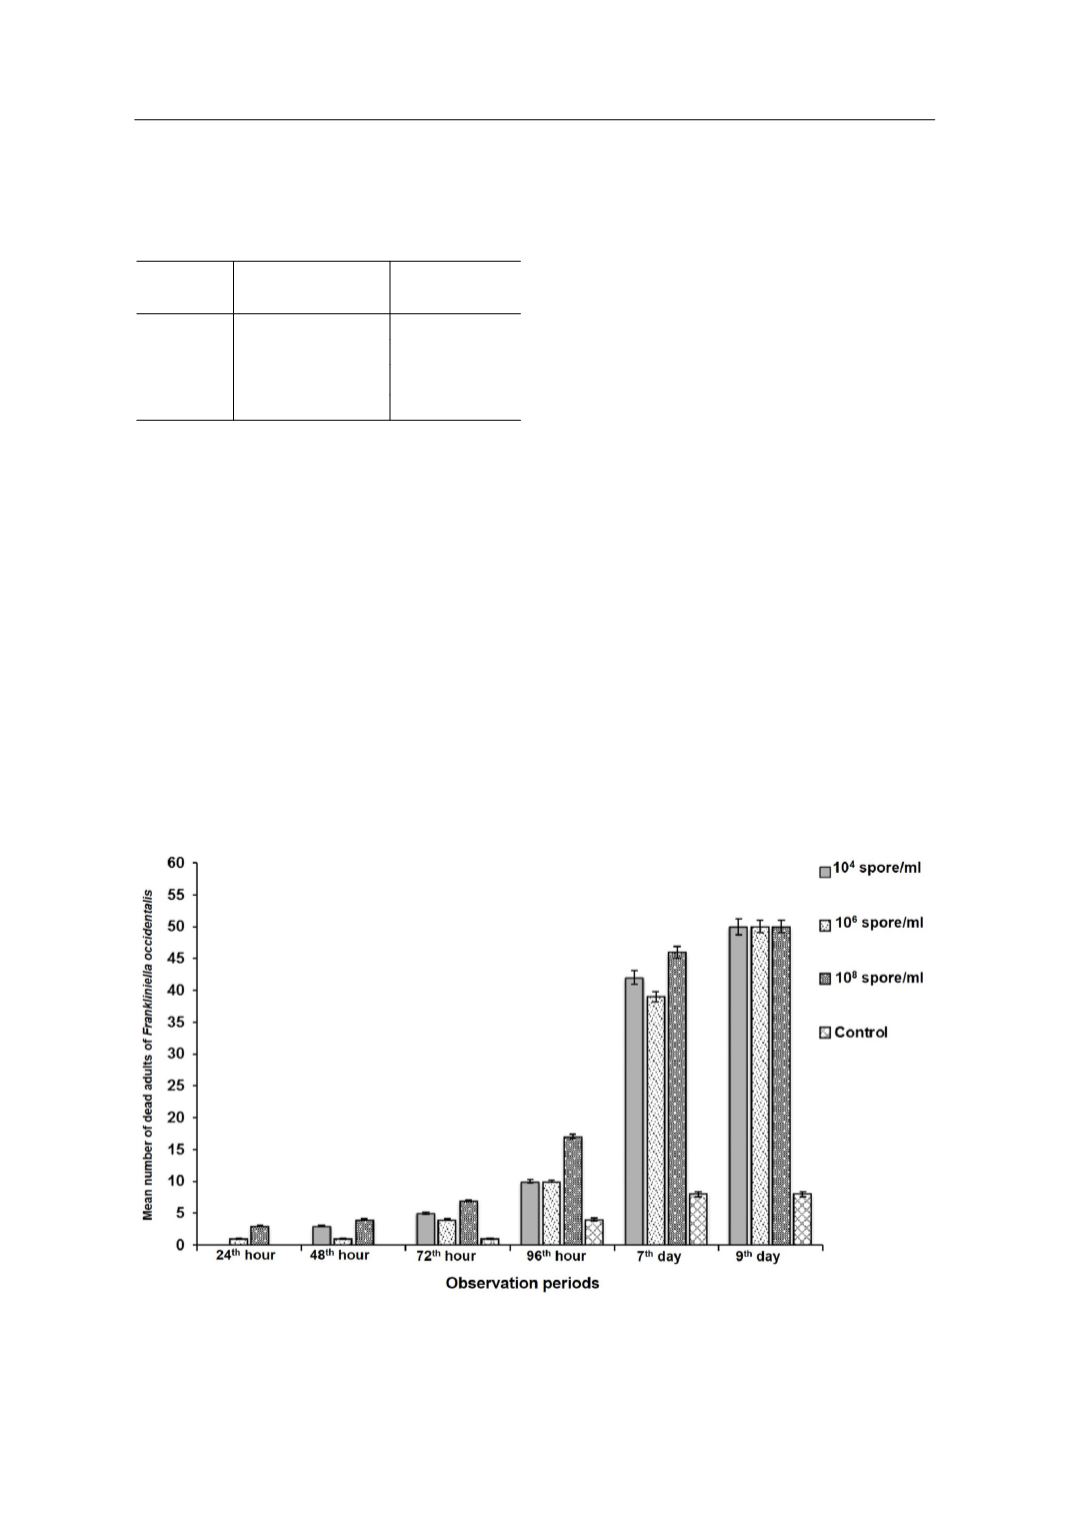
In the concentrations 10
6
and 10
8
spores/
ml, first deaths of adults were observed 24
hours after dipping, whereas this was 48
hours in 10
4
spores/ml (Figure 1). In the con-
trol, deaths were observed three days af-
ter dipping into the water and the mortality
percentage was 16% on the 8
th
day of the ex-
periment. Mortality percentage was 100% in
the three spore concentrations of
F. subglu-
tinans
12A on the 9
th
day of the experiment
(Figure 1).
The highest mycosis rate was recorded in
10
6
spores/ml (1.794 ± 0.351) and was higher
than the average mycosis rates of 10
8
and 10
4
spores/ml concentrations (P<0.05; Table 1).
The Pearson correlation coefficient between
the death and mycosis rates was 0.68 and it
was found significant (P<0.01). In addition, a
linear relationship was determined between
the death and mycosis rates and mycosis be-
came visible three days after the application
(Table 1). The highest mycosis rates were ob-
served on the 7th and 9th day after applica-
tion and the lowest rate was recorded three
days after application in all spore concen-
trations. The Pearson correlation coefficient
between the time and mycosis rate was 0.93
and it was significant (P<0.01).
Deaths of 2
nd
instar nymphs at 10
6
spores/
ml concentration of the fungus were ob-
served starting on the second day of spore
applications. The results showed that per-
centage of mortality was more than 50% on
the 8
th
day of the study (Figure 2). The ‘R’ val-
ue of average dead individuals was 0.412 and
it was different from the control (P<0.01).
Table 1.
Mean mortality of adult females of
Frankliniella occidentalis
and mycosis rate on
dead individuals after treatment with three
different spore concentrations of
Fusarium
subglutinans
12A.
Treatments
(spores/ml)
Mortality
Mean ± s.e.
Mycosis rate
Mean ± s.e.
10
4
3.67 ± 0.756 a 0.989 ± 0.230 b
10
6
3.47 ± 0.724 a 1.794 ± 0.351 a
10
8
4.20 ± 0.732 a 1.455 ± 0.262 ab
Control
0.70 ± 0.180 b
Means with different letter in the same column differ
significantly (
P <0.05
); s.e.: standard error
Figure 1.
Mean number of dead adult females of
Frankliniella occidentalis
after treatment (dipping) with three different
spore concentrations of
Fusarium subglutinans
.


